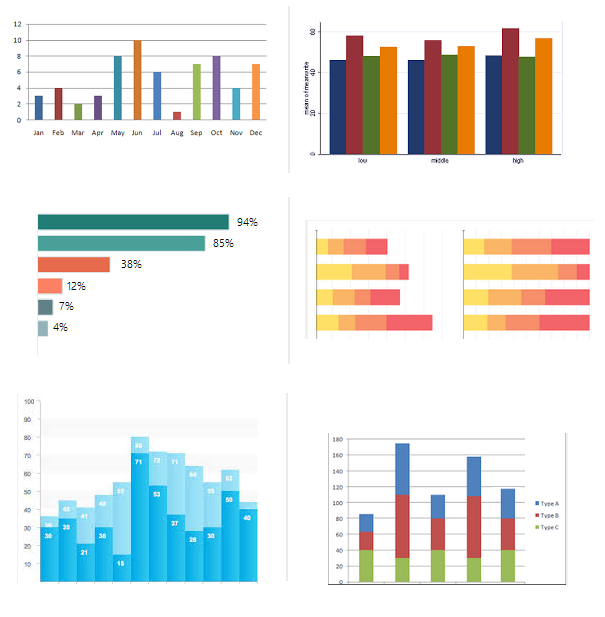
A bar graph (also known as the bar chart) is a graph that contains either horizontal or vertical bars to present data comparison or contrast among categories or variables. In your IELTS Academic task 1, you might get a bar graph that will have numerical values of different variables shown by the length and height of lines or rectangular shapes or equal width. This bar graph will show the quantitative comparison of various data or categories and you are expected to write a report or summary of the diagram. Following are some of the bar graph examples to make thing clear:

In your IELTS test, you are advised to finish your graph writing in 20 minutes. Your graph answer would be assessed best on your ability to:
» Objectively describe main information presented in the graph.
» Make compare and contrast.
» Report main features without the use of personal opinion.
Links to all Bar Graph pages:
Following is the list of IELTS bar graphs (sample 1 to 20) with the links to model answers that you should practice for your Academic IELTS test.
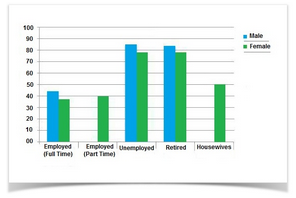
[Bar Graph Topic: Amount of leisure time enjoyed by men and women of different employment status.]
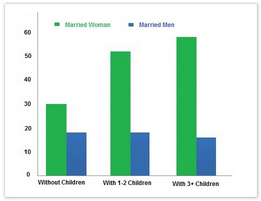
[Bar Graph Topic: Unpaid work per week done by people in different categories.]
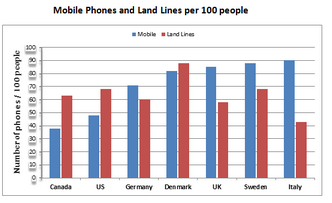
[Bar Graph Topic: Unpaid work per week done by people in different categories.]
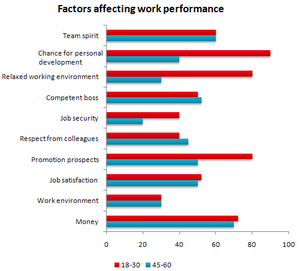
[Bar Graph Topic: Results of a survey conducted by a personnel department at a major company.]
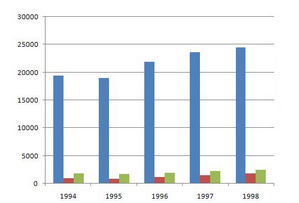
IELTS Bar Graph Sample 5: with the model answer
[Bar Graph Topic: Sampled a cross-section of 100,000 people asking if they traveled abroad and why they traveled.]
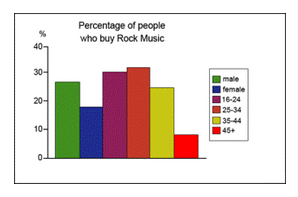
IELTS Bar Graph Sample 6: with the model answer
[Bar Graph Topic: Types of music albums purchased by people in Britain.]
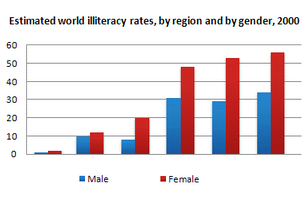
IELTS Bar Graph Sample 7: with the model answer
[Bar Graph Topic: Types of music albums purchased by people in Britain.]
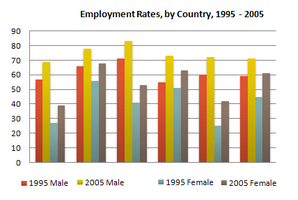
IELTS Bar Graph Sample 8: with the model answer
[Bar Graph Topic: Employment rates across 6 countries in 1995 and 2005.]
[Bar Graph Topic: What age they believed certain rights and responsibilities should be granted to young people.]
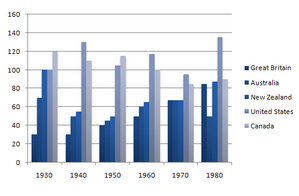
[Bar Graph Topic: Figures (in thousand) for imprisonment in five countries between 1930 and 1980.]
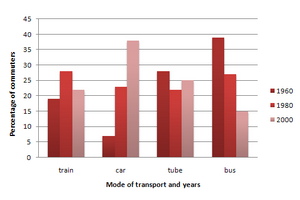
IELTS Bar Graph Sample 11: with the model answer
[Bar Graph Topic: Different modes of transport used to travel to and from work in one European city.]
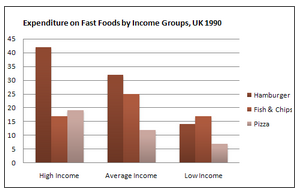
IELTS Bar Graph Sample 12: with the model answer
[Bar Graph Topic: Amount of money per week spent on fast foods in Britain.]
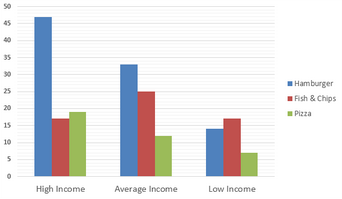 Expenditure on Fast Foods by Income Groups, UK 1990" width="" height="" />
IELTS Bar Graph Sample 13: with the model answer
[Bar Graph Topic: Expenditure in Million Pounds on fast food items by income groups in UK.]
IELTS Bar Graph Sample 14: with the model answer
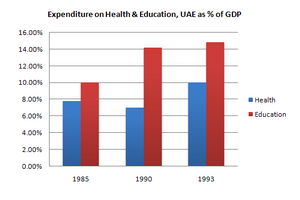
[Bar Graph Topic: Expenditure on Health & Education, UAE as the percentage of GDP.]
IELTS Bar Graph Sample 15: with the model answer
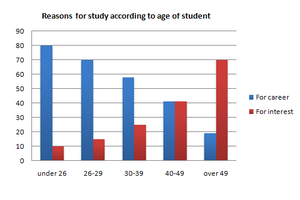
[Bar Graph Topic: Reasons for study among students of different age groups.]
IELTS Bar Graph Sample 16: with model answer
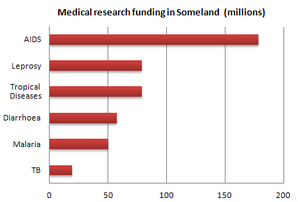
[Bar Graph Topic: Medical research funding amount in millions of Dollars in Someland.]

IELTS Bar Graph Sample 17: with the model answer
[Bar Graph Topic: Higher Colleges of Technology graduates in the UAE.]
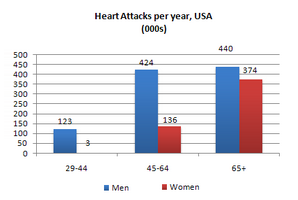
IELTS Bar Graph Sample 18: with the model answer
[Bar Graph Topic: Information about Heart Attacks by Ages and Genders in the USA.]

IELTS Bar Graph Sample 19: with the model answer
[Bar Graph Topic: Computer and Internet users in different Arab countries.]

[Bar Graph Topic: An experimental flu vaccine was trialled in a large country town on females only.]